Matplotlib用户指南中文翻译
用户指南
这份辅导指南包括最基本的使用方法和最好的训练帮助你开始使用matplotlib
1 | |
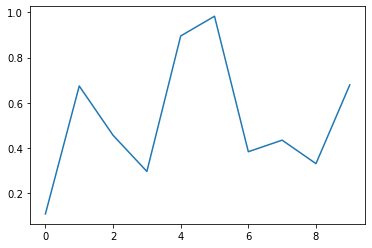
入门例子
Matplotlib将你的图片在FIgure中绘制:包括一个或多个Axes(坐标轴,包括x-y坐标、极坐标、3D坐标) 最简单的是利用pyplot.subplots来创建一个包含坐标轴Axes的Figure,然后可以用Axes.plot的方式绘制数据
1 | |

添加图片注释,不超过 140 字(可选)
在一些其他的绘图语言或者工具中并不要求你创建一个坐标轴,比如Matlab中,直接使用plot。
事实上,你可以同样实现在Matplotlib:对于任意一个Axes的绘图方法,都会有对应的方式在matplotlib.pyplot模块中让你可以在现有的坐标中中绘制。比如上面可以换写成:
1 | |
添加图片注释,不超过 140 字(可选)
Figure的组成
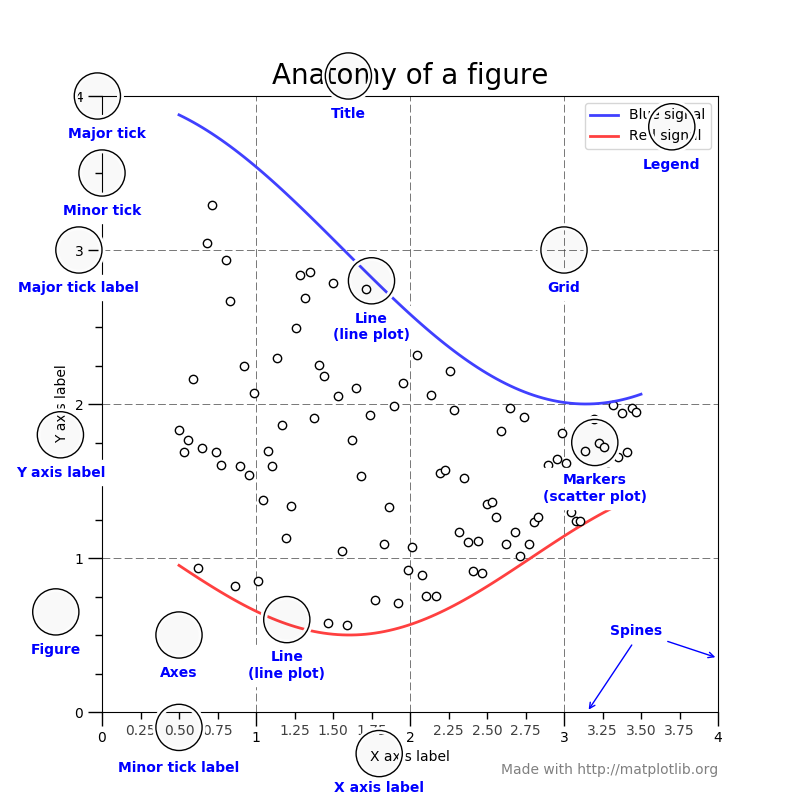
添加图片注释,不超过 140 字(可选)
Figure
完整的Figure包括坐标轴Axes的所有字类,少量的特殊特质(title、figure legend等),以及绘图各种图形元素,其中创建Figure中至少要包含一个坐标轴
可以用以下的方法创建Figure和Axes同时,也可以之后添加坐标轴来实现更加复杂的布局
1 | |

添加图片注释,不超过 140 字(可选)

添加图片注释,不超过 140 字(可选)
坐标轴Axes
这就是认识到关于绘图plot的地方,这是数据空间的绘制区域。一个给定的Figure可能包含很多Axes,但是一个Axes必须包含在一个Figure中 每个二维坐标轴具有两个Axis对象,具有以下的功能:
- axes.Axes.set_xlim( )
- axes.Axes.set_ylim( )
- axes.Axes.set_title( )
- axes.Axes.set_xlabel( )
- axes.Axes.set_ylabel( )
单根轴axis
用于控制数据的上下限,数据的刻度ticks,以及对应刻度的名称ticklabels
object- oriented interface 和 pyplot interface
在matplotlib中主要存在两种方式
- 一种是制定特定的Figures和axes,之后在其中添加各种方法method(object- oriented)
- 一种是依赖于pyplot,来管理figure和axes,利用pyplot- function来绘制(pyplot )
1 | |

添加图片注释,不超过 140 字(可选)
1 | |

添加图片注释,不超过 140 字(可选)
在matplotlib的官方教程中实例的实现方法中均包含其中两个方法,但是希望使用者可以选择其中的一个然后坚持使用它,这样才能熟练掌握,而不是将两者混淆。
通常我们建议在jupyter notebook等即时可见中使用pyplot,而在脚本环境中使用oo方式
Note from pylab import *这个方式已经被弃用了,这种方式现在并不鼓励使用,所以请删除
Backends 后段
什么是backends?
现在许多网站上大量的文档都存在“backend”这个词,许多新学者可能会被专用名词弄混淆。matplotlib旨在利用不同的backend得到不同的输出,不同的人使用不同的手段使用matplotlib,这种通过后端来交互、嵌入到其他用户图形接口中、web应用场景、批处理脚本中应用场景
为了支持这些特殊场景,matplotlib可以设置不同的输出,这些设置变成为backedns
- 第一种是user interface backends(PyQt/PySide, PyGObject, Tkinter, wxPython, or macOS/Cocoa)
- 一种是输出格式 hardcopy backends(PNG, SVG, PDF, PS; also referred to as “non-interactive backends”)
第一种作为和其他系统的接口一般使用频率不大
制定图片格式并保存
- matplotlib.pyplot.savefig(‘filename’)
1 | |
添加图片注释,不超过 140 字(可选)

添加图片注释,不超过 140 字(可选)

添加图片注释,不超过 140 字(可选)