Python 绘图完整教程
0x00 Basic setting
What is matplotlib? Matplotlib is a comprehensive library for creating static, animated, interactive visualization in Python. We can as follows:
- 创建高质量的图片
- 创建可以交互的、放大、拖动、更新的图片
- 定制化风格和尺寸
- 导出为不同的格式
- 在Jupyter notebook或其他应用中使用
- 丰富的第三方库
在使用中图片可以按照A4比例来进行设置,同时设置对应的字体和颜色
1 | |
0x01 Intro to Matplotlib pyplot
1.1 两种绘图方式
- 面向对象(Objetc- oriented style)的绘图方式将图片的fig和axis区分开来,使用plt.subplots( )来创建figure对象
- 函数编程,直接使用封装好的plt.figure() plt.plot()来创建figure和绘图对象
1.2 图片对象包括哪些属性
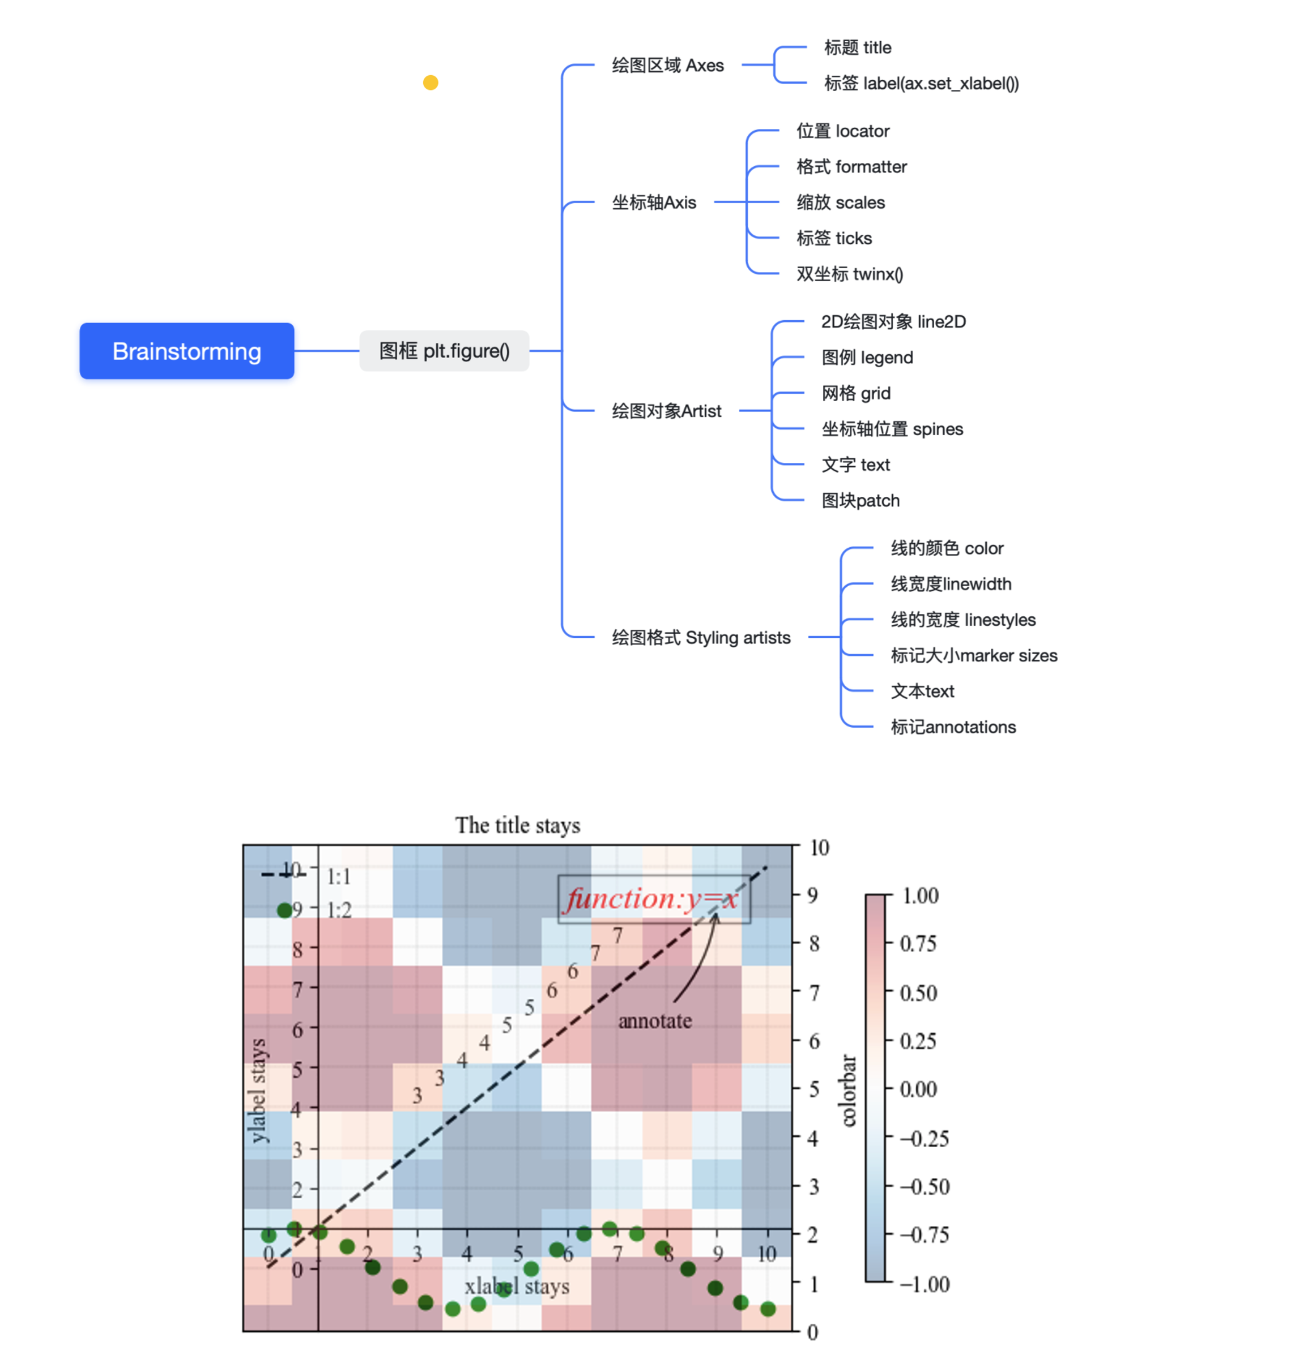
1 | |
1.3 Pyplot 设置
上面的图形选项很多,从学习的角度可以全而广的了解,从实际使用的角度可能只会用到其中的几个。
color:pink。lightblue;
1 | |
colormap:RdBu
linestyle:https://matplotlib.org/stable/gallery/lines_bars_and_markers/linestyles.html#
marker:https://matplotlib.org/stable/gallery/lines_bars_and_markers/marker_reference.html
等等,除此之外还需要设置针对不同的图增加不同的表达方式。这个就需要从图的种类开始学习。
1.4 Image展示设置
可以通过PIL的Image.open实现图像转换为numpy.array,之后使用imshow方式来可视化图片。同时可以图像进行通道遮盖、色彩映射、添加colorbar等展示,并计算色彩范围,重塑图片大小、插值等操作
0x02 Figure from the Matplotlib
选择官方https://matplotlib.org/stable/gallery/index.html 中一些比较有意思的作为参考
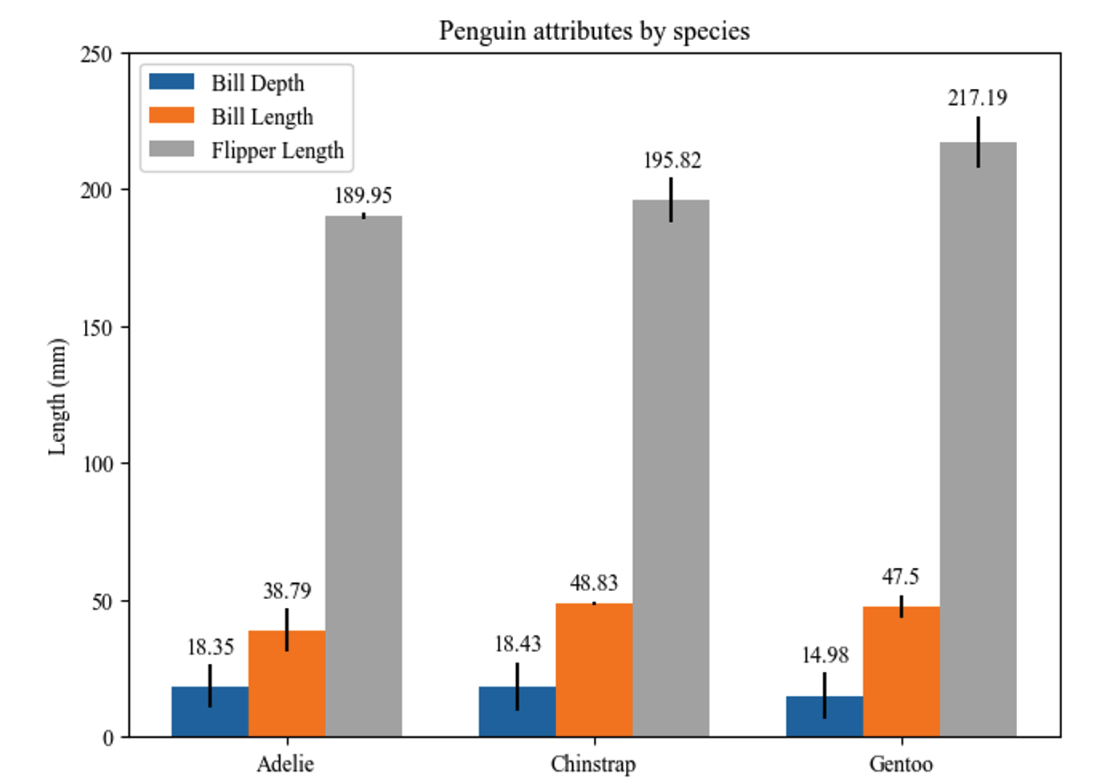
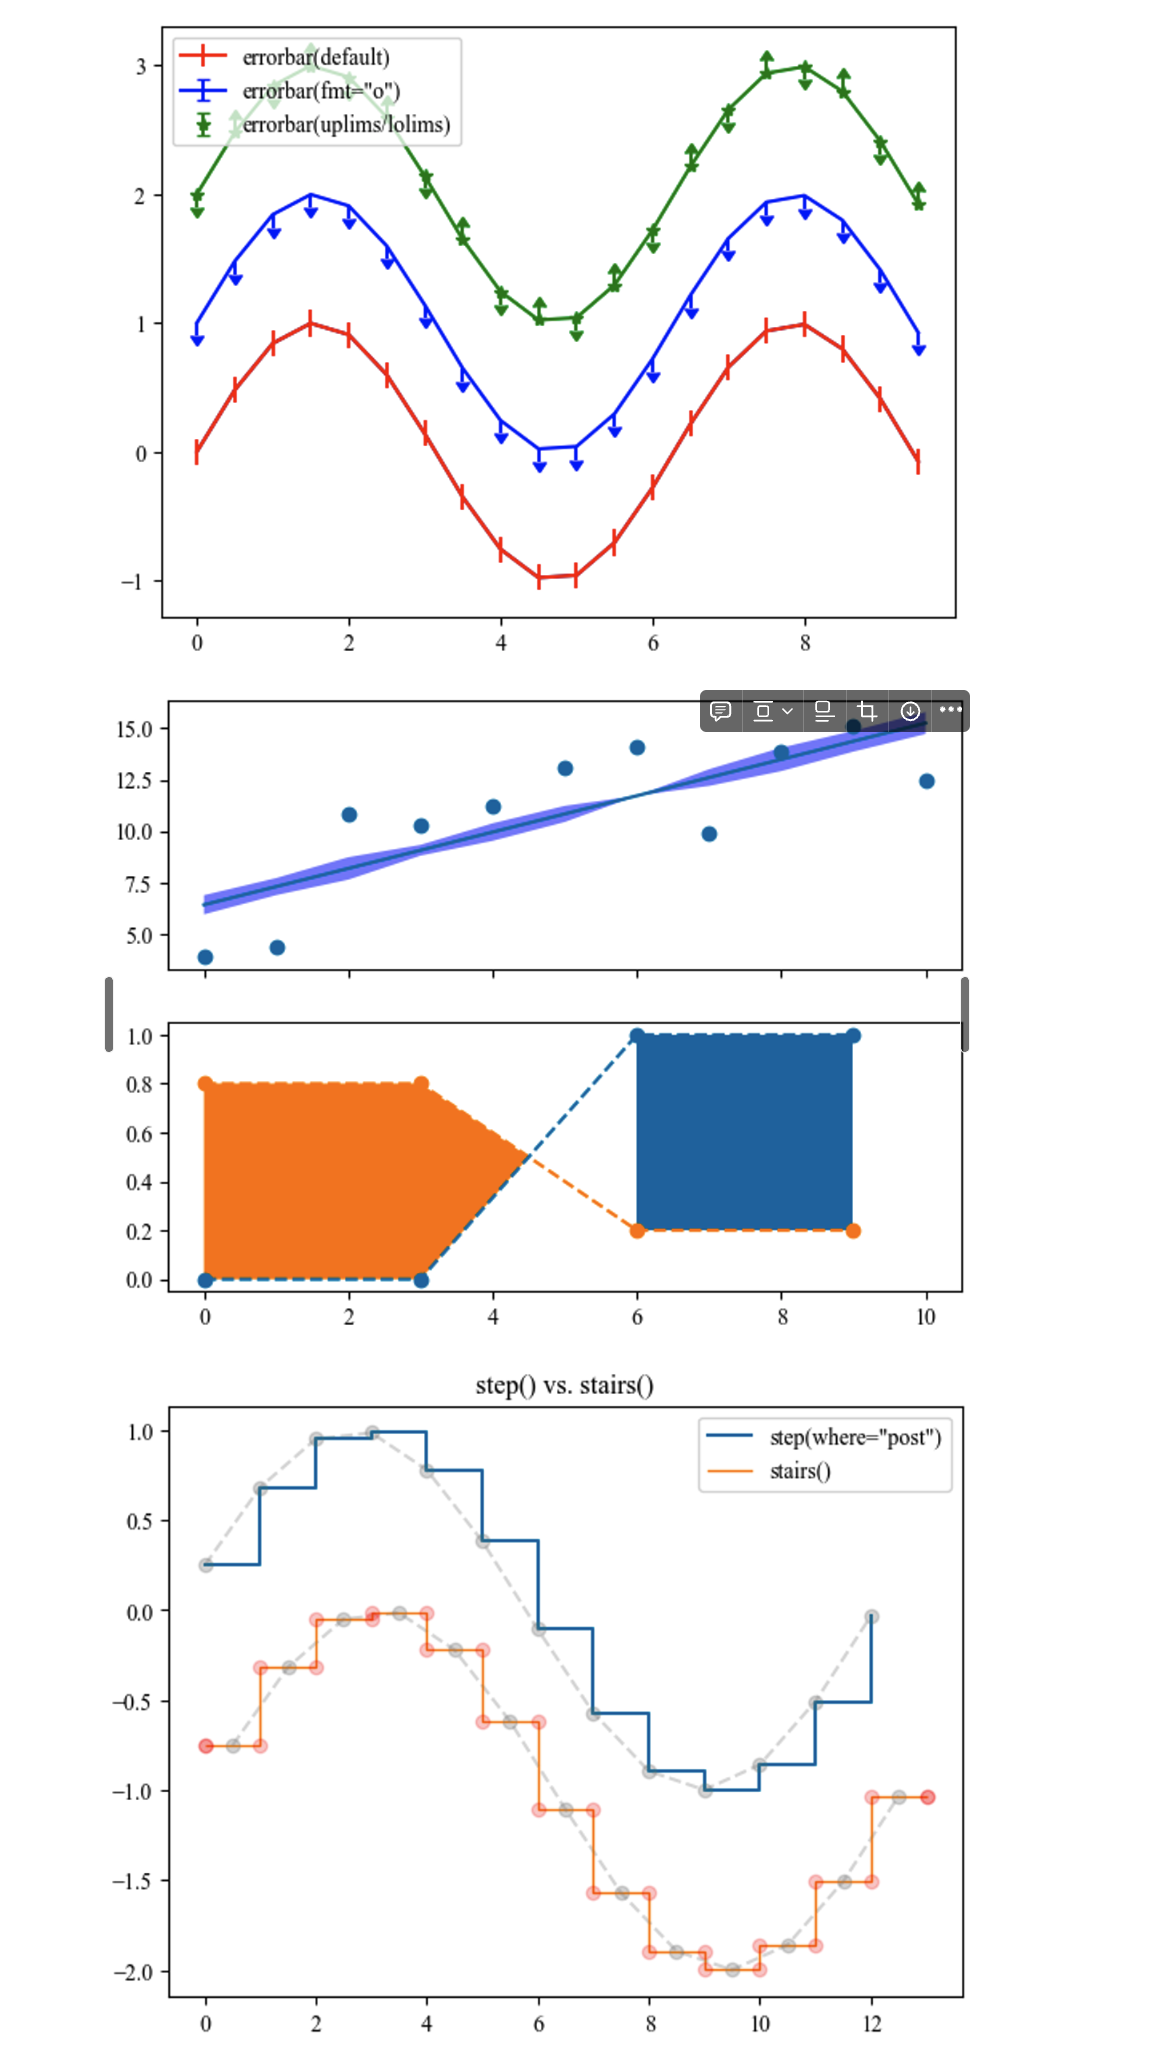
2.1 直线(Lines)、条形图(Bar)、标记(Markers)
- ax.bar_label 给bar添加标签
- ax.bar(…,xerr=error,…) 添加误差线
- 通过添加upperlimits来设置误差线的箭头
- fill_between 填充,可以设置where参数
- dash style的设置。set_dash间隔
- steps 和 stair设计
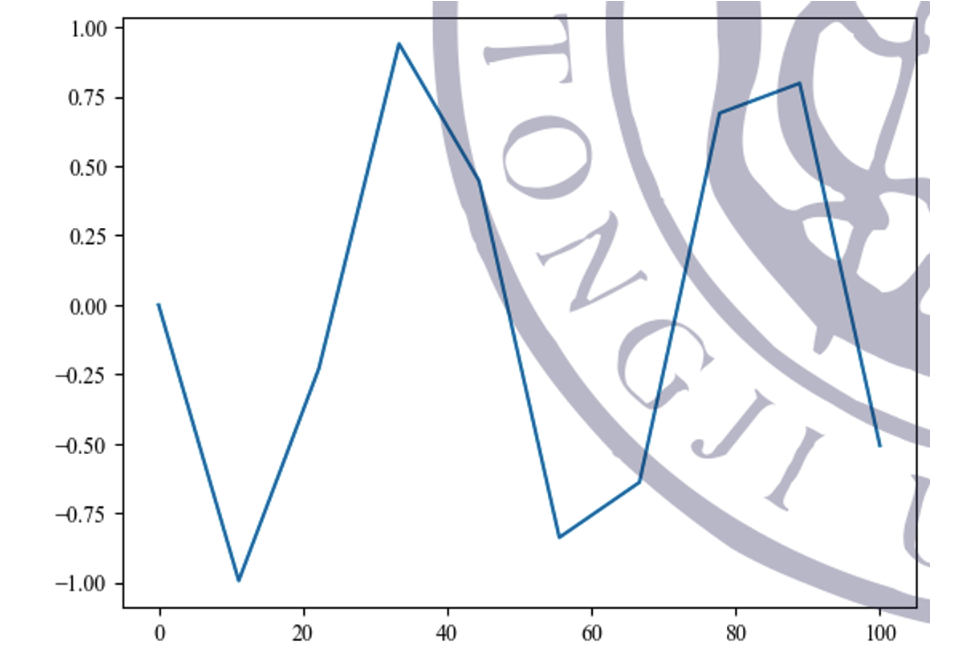
 2.2 图片(Images),轮廓(Contours)和平面(Filed)
- 添加水印 fig.figimage
- 绘制轮廓
- matshow显示二维数组
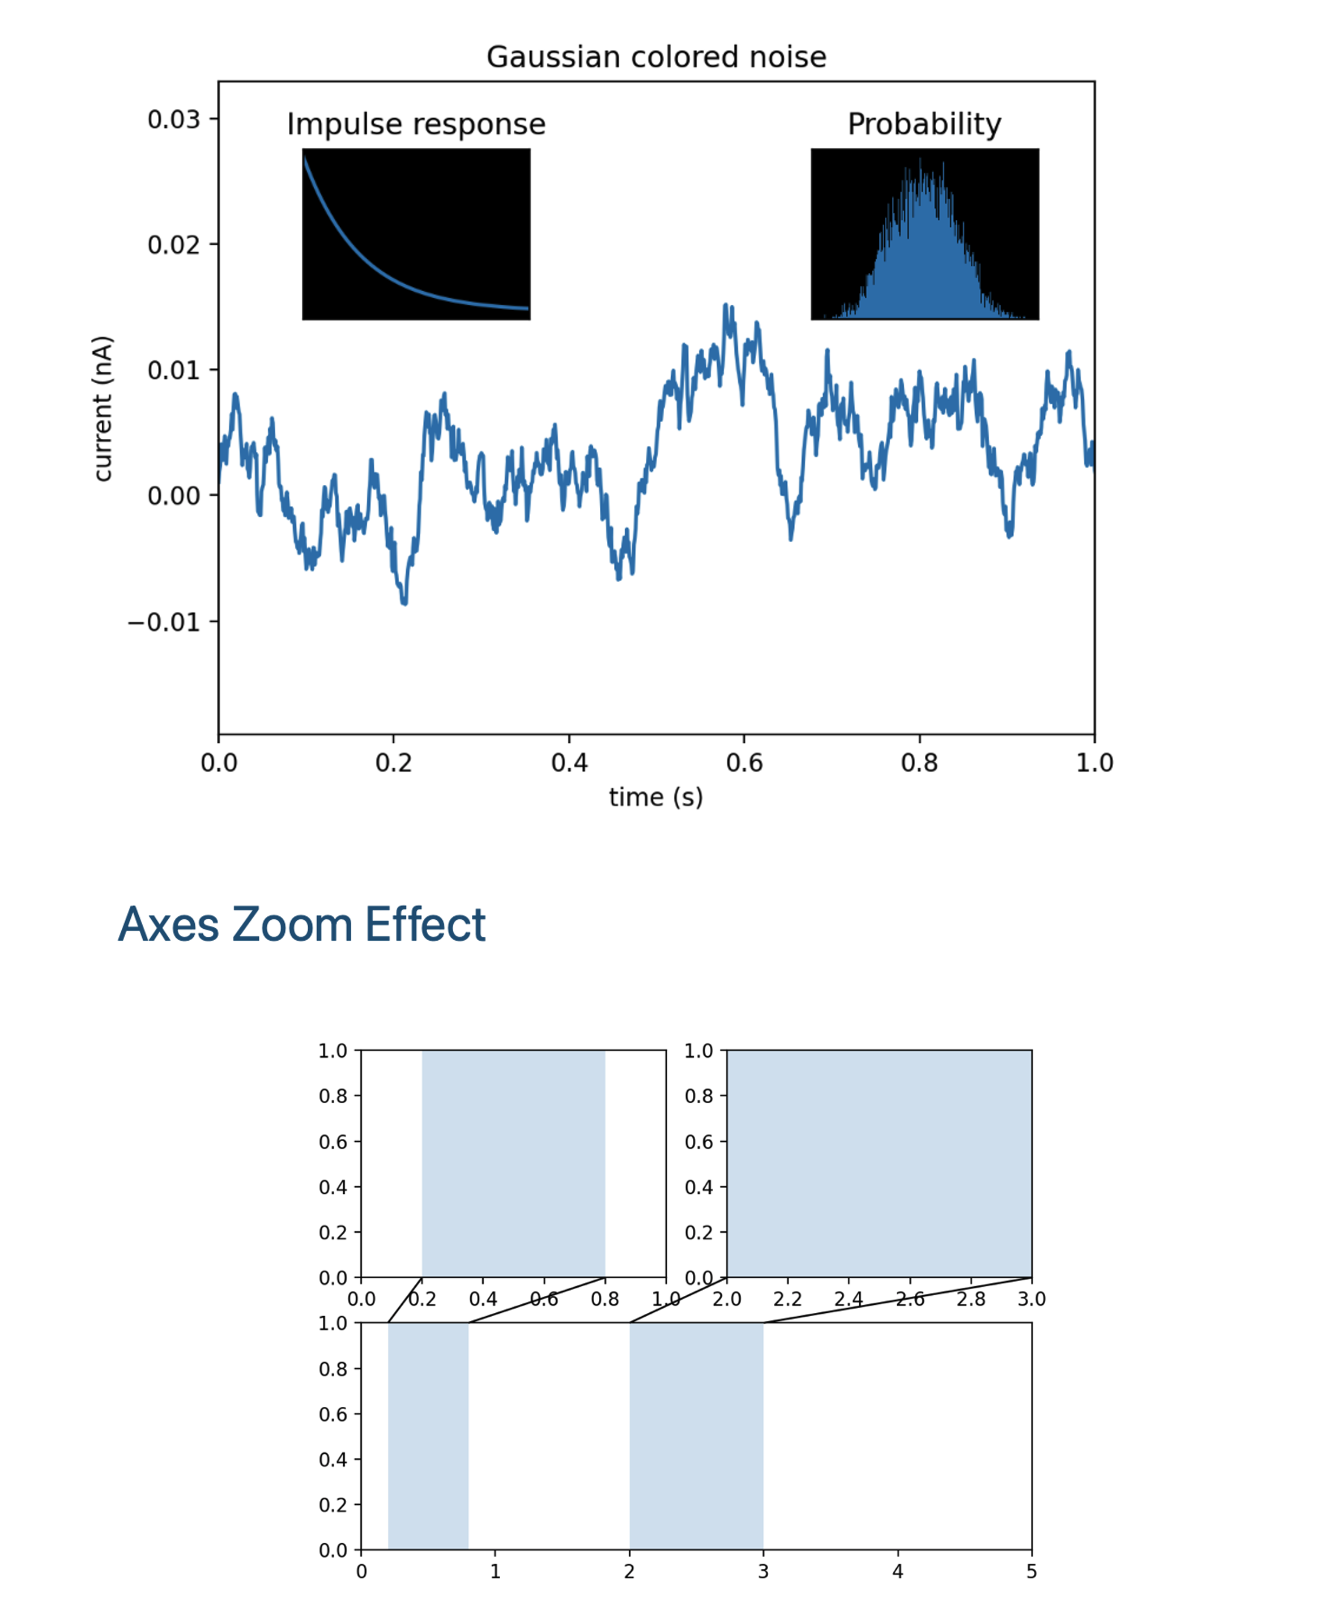
2.3 子图(Subplot),坐标轴(Axes)和图(Figures)
- 在axes中增加add_axes()
- 创建多张axes之间的链接
- 放大效果,axins插入一个框,同时设置set_xlim和set_ylim
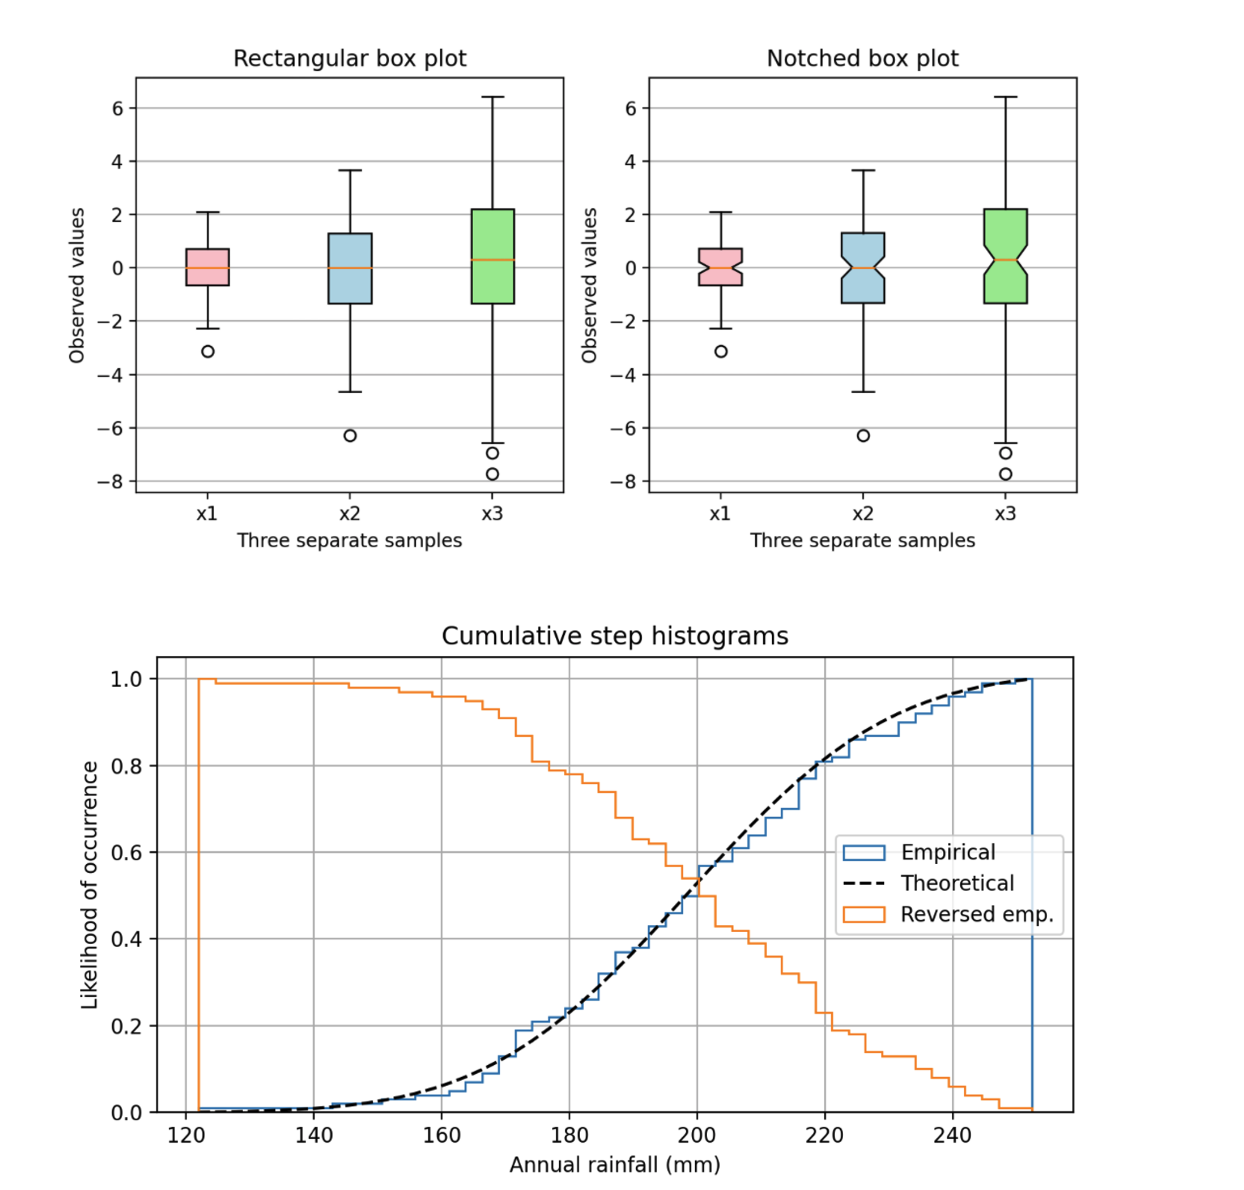
2.4 统计(Statistics)
- 箱图boxplot,可以选择vert垂直标记,path_artist是否填充颜色,labels
- 箱型图hist,可以返回cumulative的数据
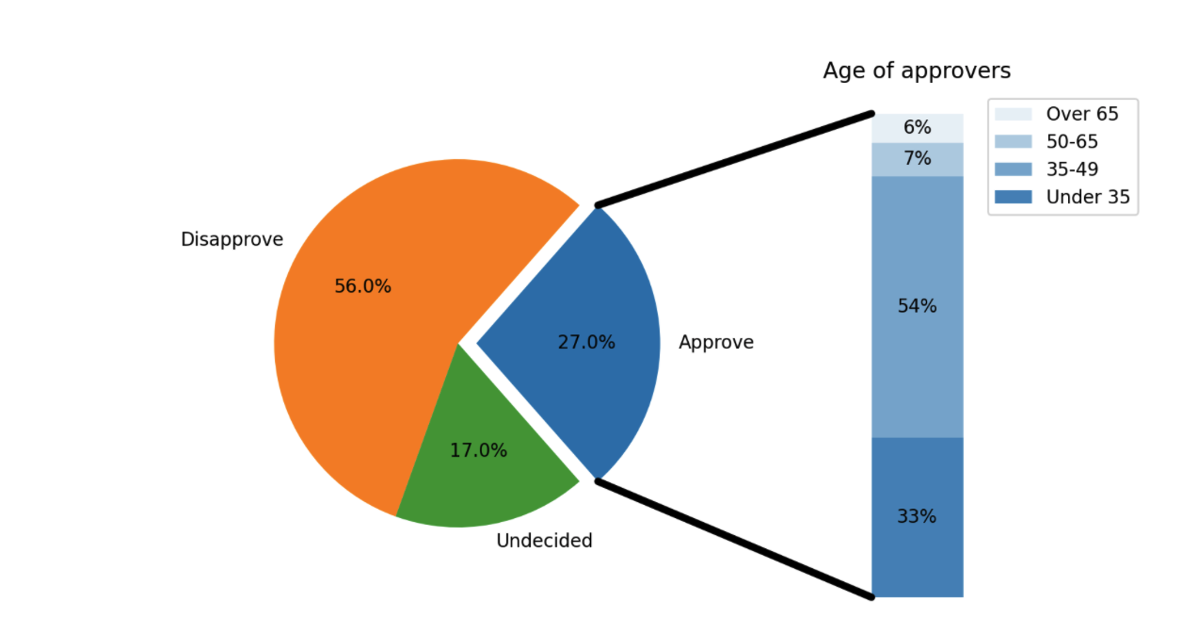
 2.5 饼图(Pie)和极坐标图(Polar charts)
- 有pie绘制图,用bar绘制堆叠图,之后使用connectionPatch来进行两者的链接
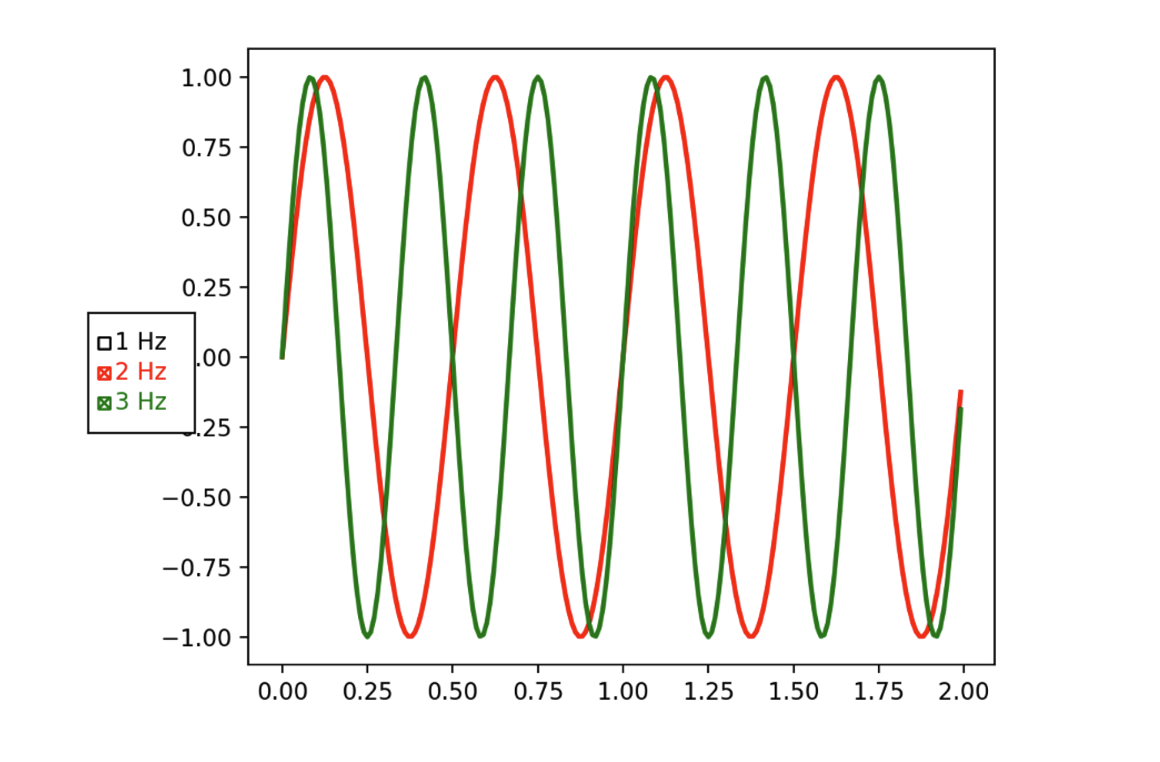
2.6 文本(Text)、标签(Label)和标记(Annotation)
- 不玩花的
2.7 pyplot module
- 辅助线 axhlines,axvhline
2.8 颜色(Color)
- colormap,https://matplotlib.org/stable/gallery/color/colormap_reference.html#sphx-glr-gallery-color-colormap-reference-py
- colors,https://matplotlib.org/stable/gallery/color/named_colors.html#sphx-glr-gallery-color-named-colors-py
2.9 形状和(Shapes)和集合(Collections)
- 不玩花的
- 通常在matplotlib patch中的形状或者路径https://blog.csdn.net/qq_27825451/article/details/82967904
2.10 风格指南(Style sheet)
2.11 坐标轴网格
- 略
2.12 坐标轴设计
- 略
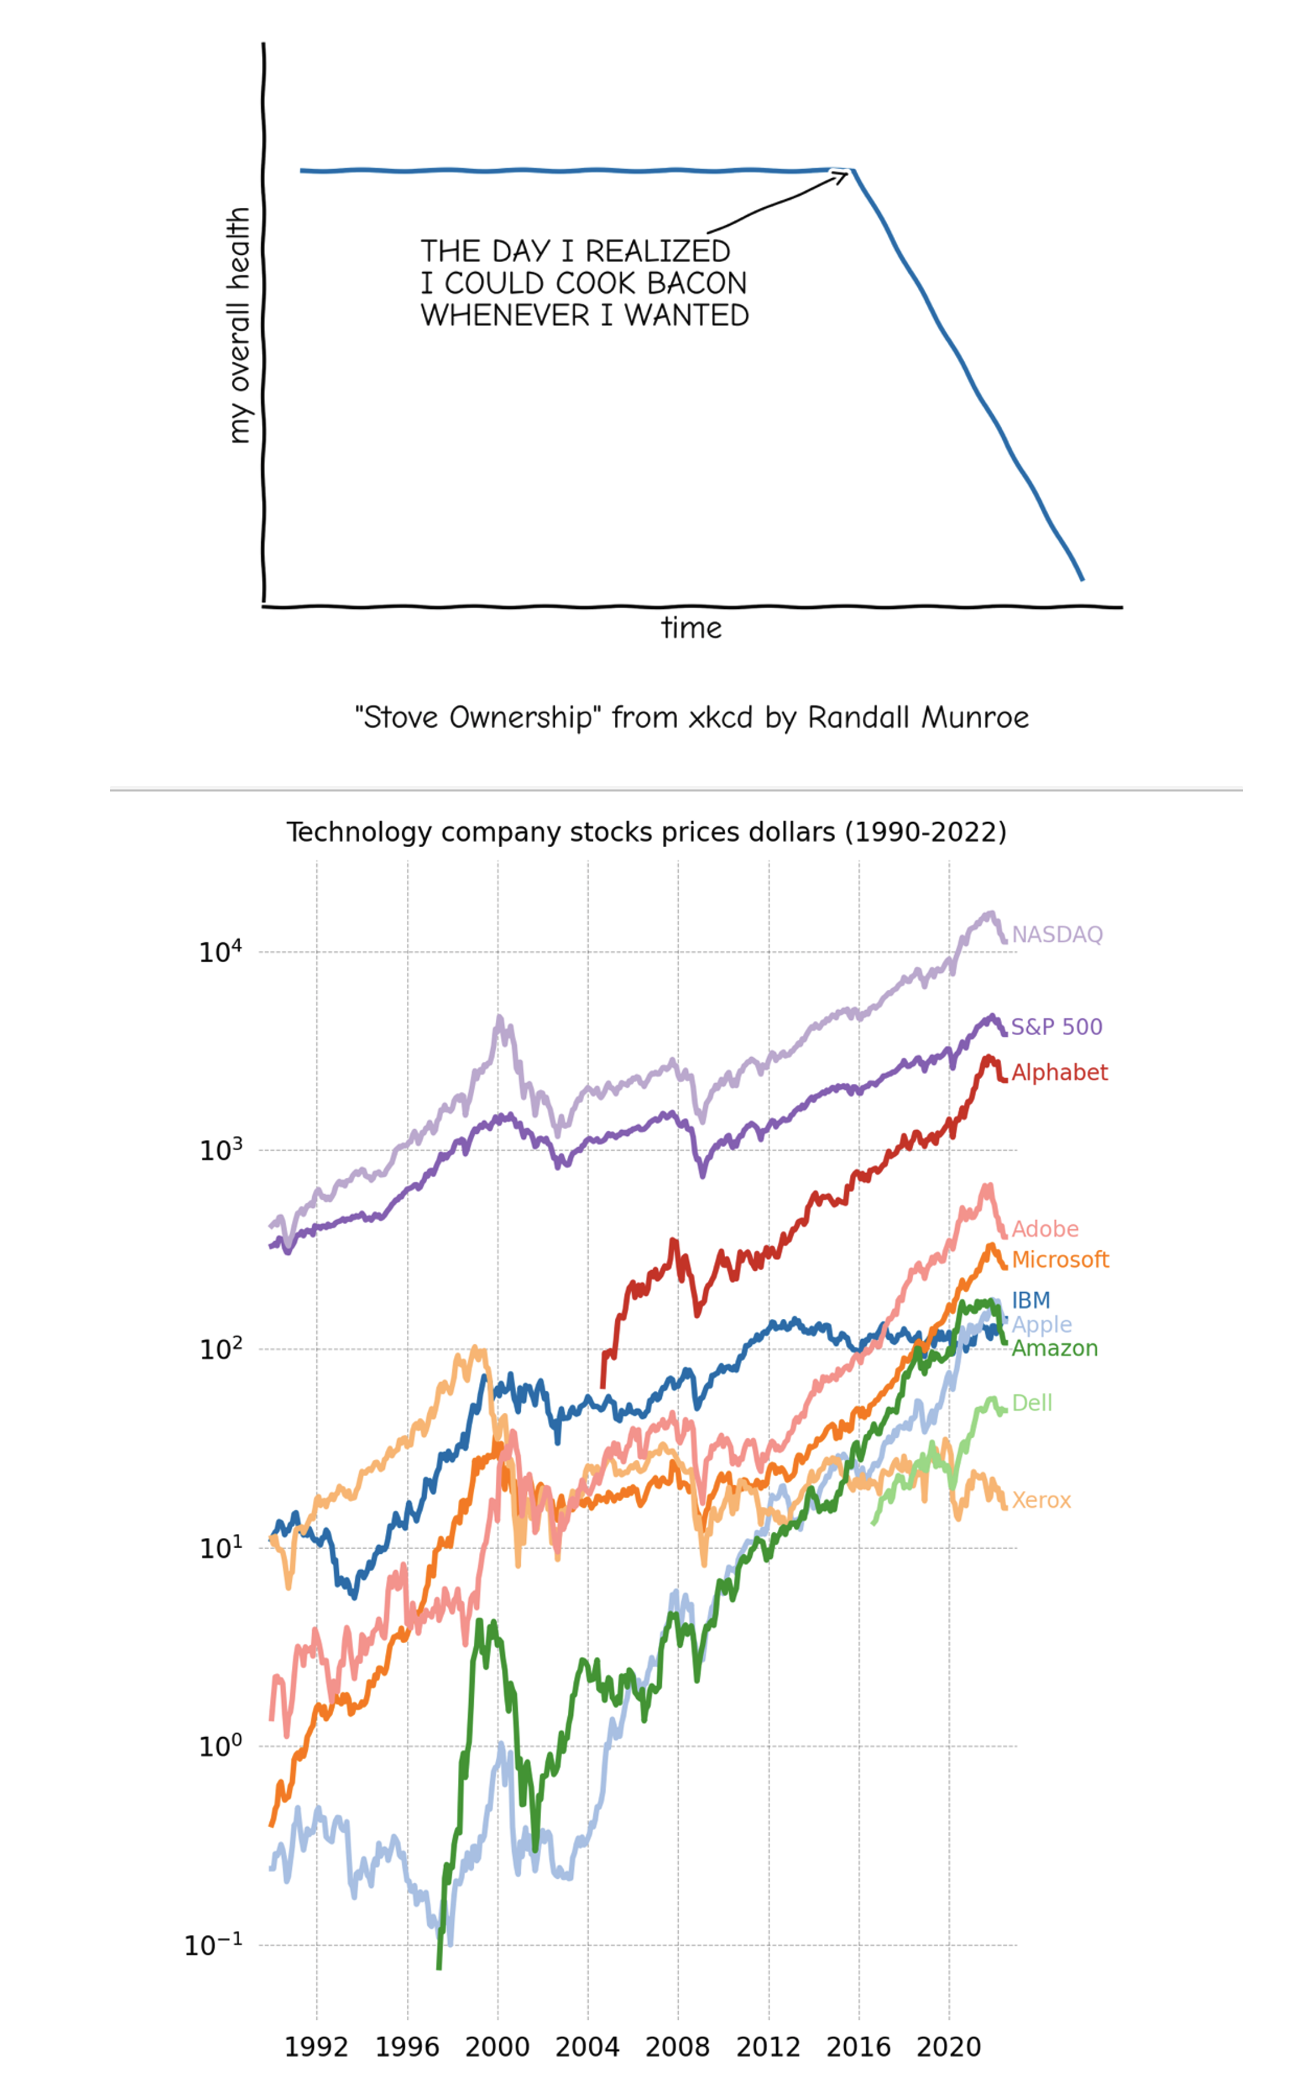
2.13 特殊例子 Show case
- xkcd非常好玩
- 好看的颜色
2.14 动画 Animation
- 调用animation.FuncAnimation就可以实现动图
- 不玩花的
2.15 事件句柄 (Event handling)
- 动态交互,不玩花的
2.16 混杂的(Miscellaneous)
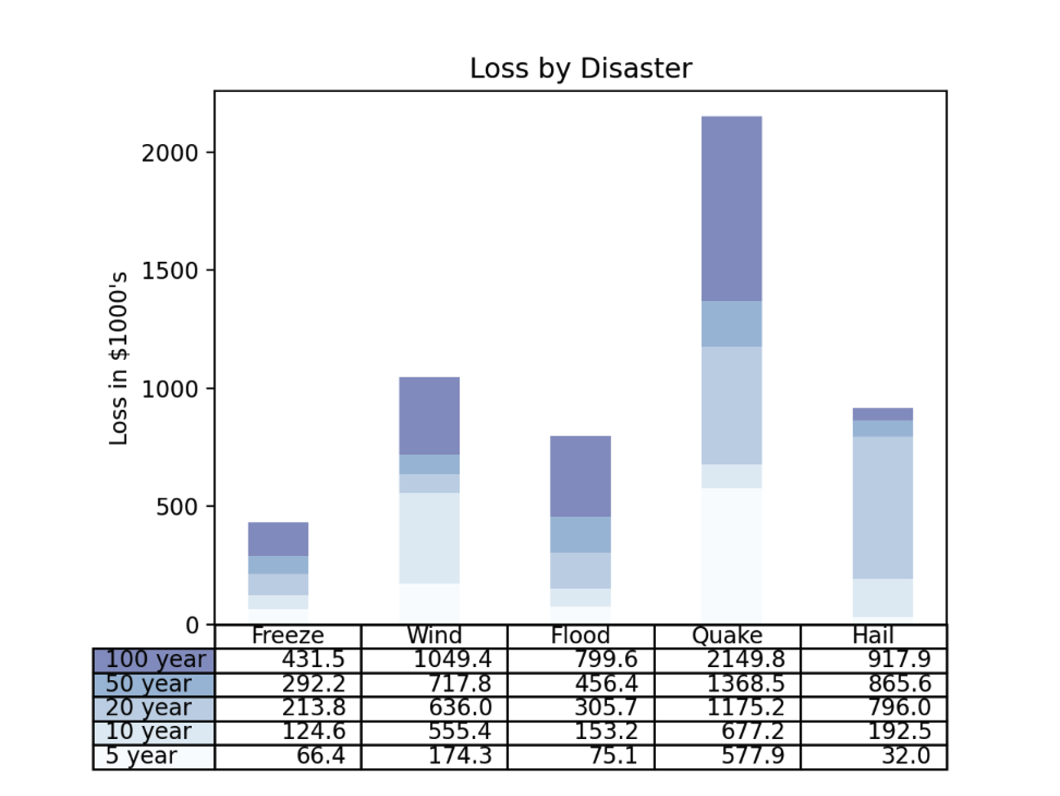
- 给图添加table,可以使用plt.table对象
2.17 3D绘图(3D plotting)
2.18 缩放(Scales)
2.19 特殊绘图(Specialty plots)
2.20 坐标框(Splines)
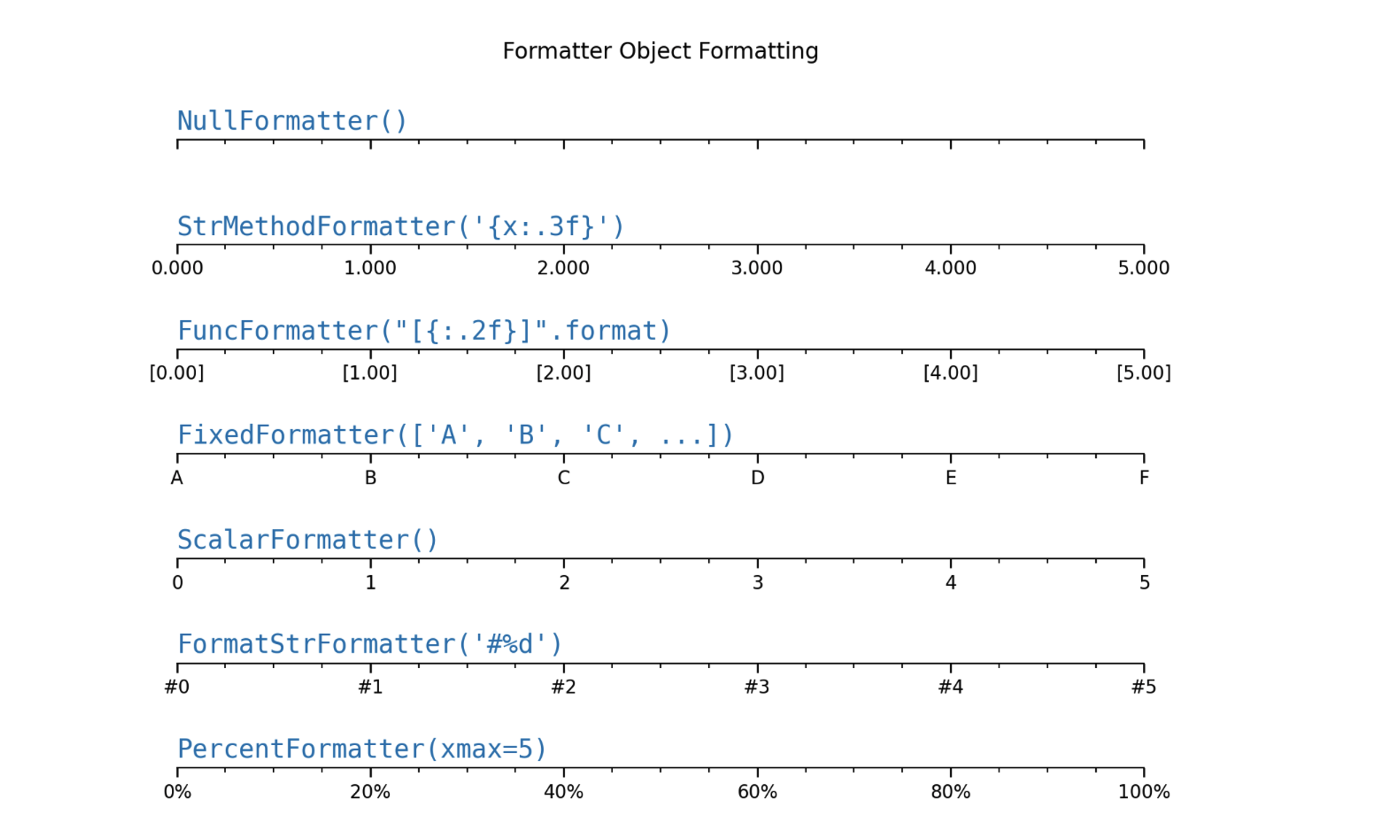
2.21 标签(Ticks)
- 坐标
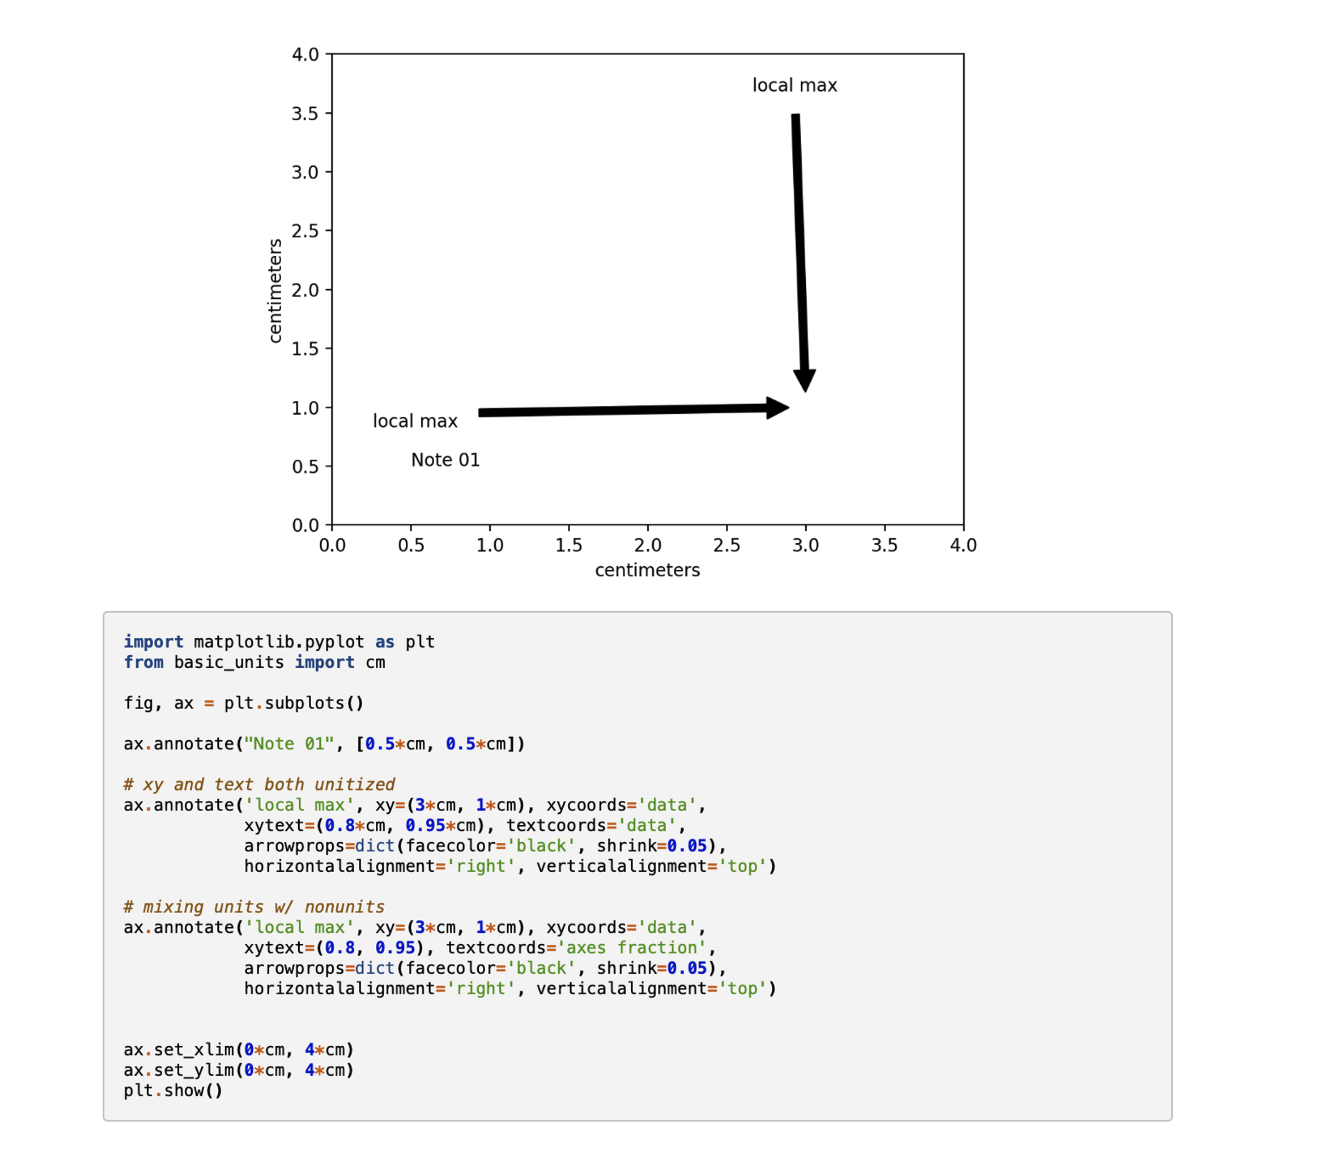
2.22 单位(Units)
- 我超!可以从basic_unit中导入cm
2.23 嵌入(Embedding into GUI)
- 略
2.24 组件(Widgets)
- 指针 cursor添加一些操作,tracking position
- 按钮 button
- 确认 check
- 选择 selector
- 选择器 menu
- 鼠标 mouse
- 区间选择 rangeslider
似乎没这个必要哈哈哈
2.25 用户例子(Userdemo)
-
Python 绘图完整教程
https://blog.tjdata.site/posts/7f325577.html